Average Rent In London By Borough: Compare All 32 Areas
Average rent in London by borough with a full 32-borough table, cheapest areas, 1-bed and 2-bed examples, and affordability by earnings.
Author:James RowleyApr 04, 202640 Shares10K Views
Average Rent In London By Borough - 32 Boroughs, 1-Bed Costs, And Affordability
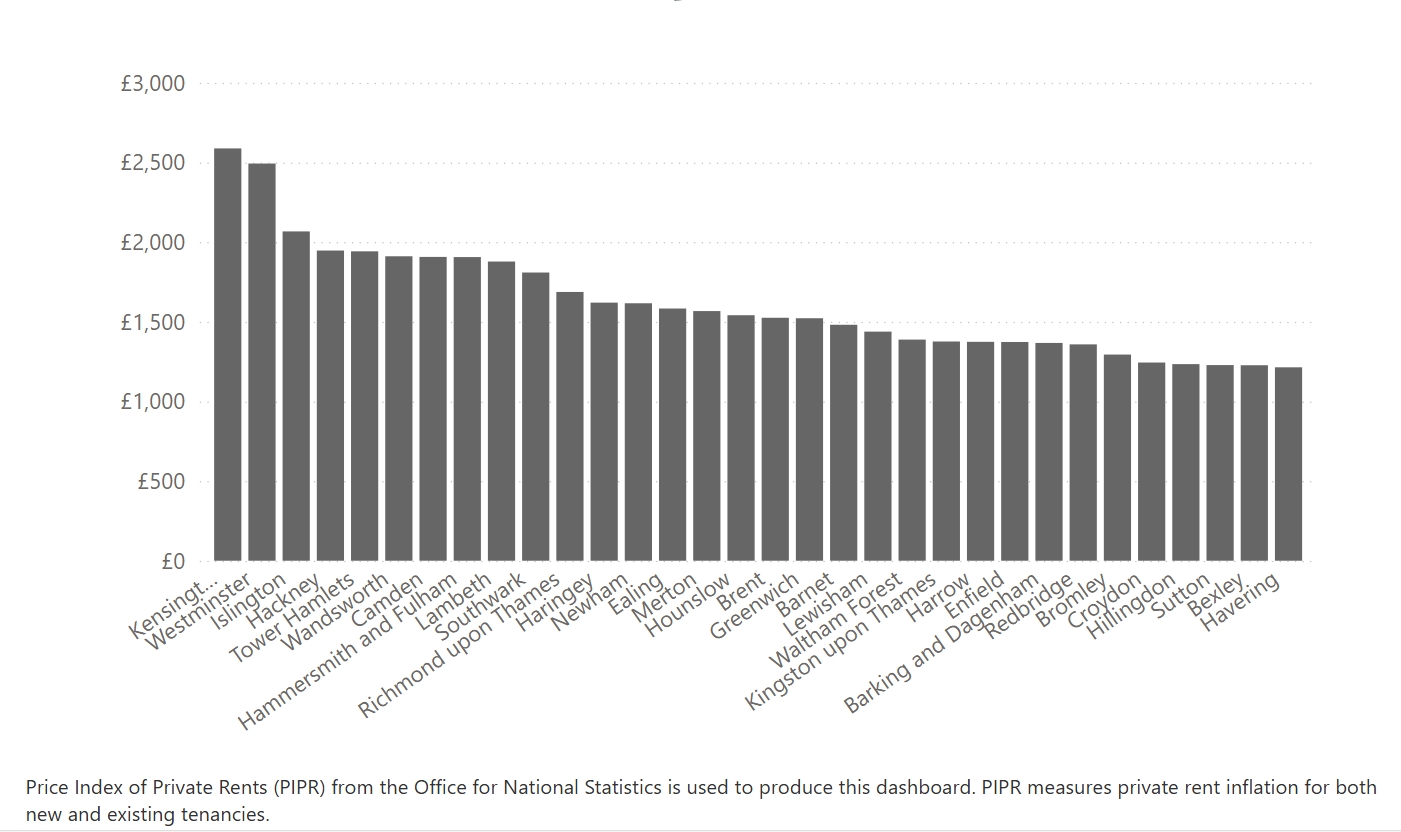
Average rent in Londonby borough currently ranges from about £1,536 in Bexley to £3,628 in Kensington & Chelsea, with a London-wide average of £2,273 per month.
London’s boroughs sit in very different price bands, so the citywide average is useful for context but not for choosing where to rent.
Key Takeaways
- London-wide average monthly private rent is £2,273.
- The cheapest borough in the current table is Bexley at £1,536, and the most expensive is Kensington and Chelsea at £3,628.
- For solo renters, one-bed figures are more useful than borough-wide averages.
- Affordability changes the picture. Trust for London says a typical one-bed costs 52% of median pre-tax pay across London, compared with 42% in the rest of England.
- The strongest shortlist usually comes from three filters: borough average, property type, and real monthly costs.
- Source note:ONSfor current borough rents and London-wide average; Trust for London for affordability.
Average Rent In London By Borough At A Glance
London remains the most expensive English region for private rent. The official citywide average is £2,273 a month, but borough-level differences are wide enough to matter much more than the London average once you are actually choosing where to live.
London also had the lowest annual private rent inflation of any English region in the year to February 2026, at 1.7%.
The broad pattern is easy to see. Central and inner-west boroughs dominate the premium end of the market, while most of the cheapest boroughs sit in outer London.
The spread between the lowest and highest boroughs is just over £2,000 a month, which is large enough to change whether you can rent solo, need to share, or can stretch to a larger home.
Treat borough averages as a starting point, not as a quote for a specific flat. Once you move to one-beds, two-beds, or shared housing, the shortlist can change quickly.
What The Latest Borough-level Data Shows
Using the current ONS local housing pages, the spread between the cheapest and priciest boroughs is just over £2,000 per month. That spread is large enough to change not just postcode choice, but whether you can realistically rent solo, need to flatshare, or can move up from a one-bed to a two-bed.
A second pattern is just as important: inner and central boroughs dominate the upper tier, while most of the cheapest boroughs are in outer London. That pattern is not universal, but it is strong enough to shape the whole market.
Treat borough averages as a starting point, not a quote for a specific home. Once you move to one-beds, two-beds, or shared housing, the shortlist can change quickly.
What Changed Over The Past Year
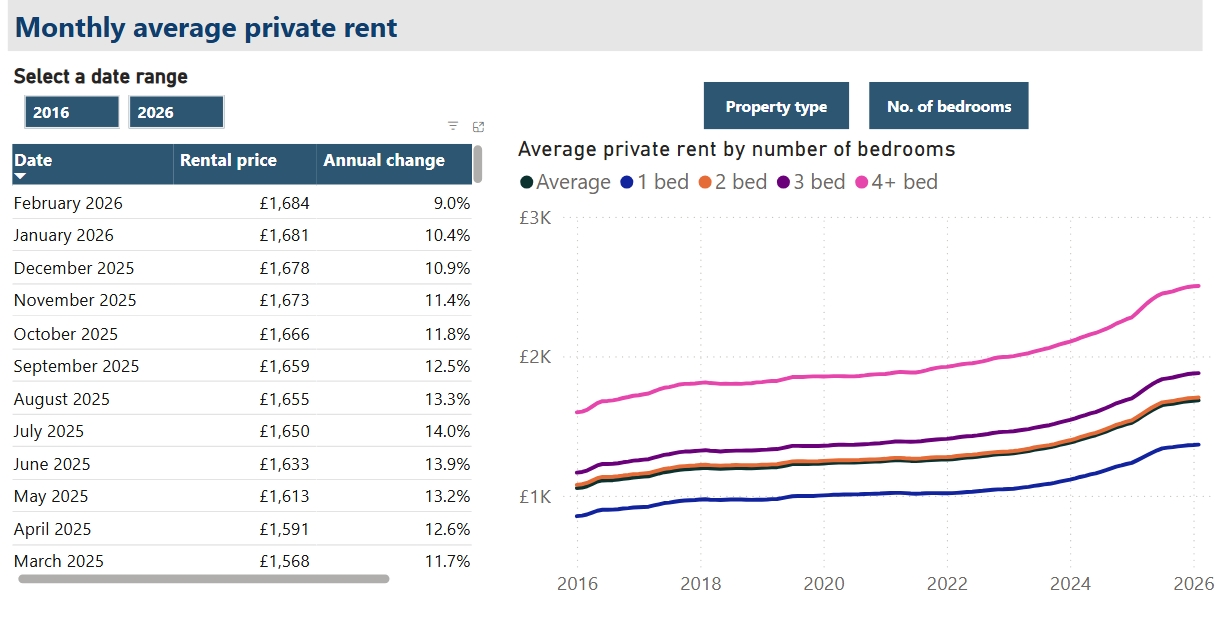
London rent is still high, but the pace of growth has slowed. ONS says annual rent inflation in London was 1.7% in the 12 months to February 2026, down sharply from the recent peak of 11.5% in November 2024.
That matters because renters are no longer just asking where prices are high. They are also asking whether the market is still accelerating or starting to cool.
For longer-term context, London City Hall’s London Rents Map lets readers compare rent levels by home type and explore longer-term trends since 2015.
How The Official Data Works
Two official views of the market often appear in search results. The ONS local housing pages give the freshest borough-level snapshot and are updated monthly. London City Hall’s London Rents Map is useful for comparing home types and longer-term patterns across boroughs.
Those sources are both useful, but they are not identical. City Hall says the London Rents Mapreflects ONS PIPR-based rent data for new and existing tenancies and presents average rents at borough level, while the ONS borough pages are the cleaner source for the latest local snapshot. That is one reason different sources can show slightly different figures at the same time without being contradictory.
Average Rent In All 32 London Boroughs
The full borough table is the quickest way to see where your budget fits.
Source:ONS local housing pages for current borough averages. City of London is not included because official estimates are not published for low-volume data.
| Boroughs | Avg. monthly private rent |
| Barking & Dagenham | £1,684 |
| Barnet | £1,926 |
| Bexley | £1,536 |
| Brent | £1,946 |
| Bromley | £1,663 |
| Camden | £2,624 |
| Croydon | £1,556 |
| Ealing | £2,052 |
| Enfield | £1,767 |
| Greenwich | £1,943 |
| Hackney | £2,589 |
| Hammersmith & Fulham | £2,701 |
| Haringey | £2,197 |
| Harrow | £1,752 |
| Havering | £1,564 |
| Hillingdon | £1,548 |
| Hounslow | £1,902 |
| Islington | £2,733 |
| Kensington & Chelsea | £3,628 |
| Kingston upon Thames | £1,808 |
| Lambeth | £2,522 |
| Lewisham | £1,806 |
| Merton | £2,079 |
| Newham | £1,910 |
| Redbridge | £1,716 |
| Richmond upon Thames | £2,276 |
| Southwark | £2,388 |
| Sutton | £1,544 |
| Tower Hamlets | £2,391 |
| Waltham Forest | £1,748 |
| Wandsworth | £2,603 |
| Westminster | £3,138 |
Start With Your Rent Cap
- If your monthly rent cap is under £1,600, start with: Bexley, Sutton, Hillingdon, Croydon, and Havering.
- If your cap is under £1,800, add: Barking & Dagenham, Bromley, Redbridge, Waltham Forest, Harrow, and Enfield.
- If your cap is under £2,000, add: Kingston upon Thames, Lewisham, Hounslow, Newham, Barnet, Greenwich, and Brent.
Cheapest Boroughs, Mid-range Boroughs, And Most Expensive Boroughs
At the lower end, the current cheapest cluster is Bexley, Sutton, Hillingdon, Croydon, and Havering. The broad middle includes boroughs such as Barnet, Greenwich, Hounslow, Newham, and Merton.
The highest-cost group includes Southwark, Tower Hamlets, Lambeth, Hackney, Wandsworth, Camden, Hammersmith & Fulham, Islington, Westminster, and Kensington & Chelsea.
- Cheapest five:Bexley, Sutton, Hillingdon, Croydon, Havering
- Most expensive five:Kensington & Chelsea, Westminster, Islington, Hammersmith & Fulham, Camden
Why City Of London Is Not Usually Included In The Official Borough Table
Official London rent tools usually do not publish City of London borough figuresbecause the data volumes are too low for a stable estimate. City Hall states this explicitly on the London Rents Map, and ONS says local housing pages are not produced for City of London because the survey samples are too small.
That omission is normal and comes down to data volume, not a missing row in the research.
Cheapest London Boroughs To Rent Right Now
For renters starting with price, the cheapest boroughs are the obvious first shortlist. The more useful question is which of them still look good once commuting and affordability come into view.
The Lowest-rent Boroughs In Outer London
The cheapest boroughs right now are Bexley (£1,536), Sutton (£1,544), Hillingdon (£1,548), Croydon (£1,556), and Havering (£1,564).
These boroughs form the lowest-cost edge of the London rental market and are the natural shortlist for price-sensitive renters.
What Renters Gain And Give Up In Cheaper Boroughs
Lower rent can make the jump from a room to a one-bed, or from a one-bed to a two-bed, more realistic. The trade-off is often time, distance, or travel cost if your routine is tied to central London.
Budget Check: I would never stop at “cheapest borough.” I would pressure-test three questions next:
- How many days a week do you need to commute?
- Do you need a one-bed, or would a room or studio work?
- Does saving on rent force you into higher transport or time costs?
That is why some outer boroughs look better than others once affordability enters the picture.
Which Cheaper Boroughs May Still Offer Strong Value
Some boroughs stand out not just because rents are lower, but because they look better against local earnings. Trust for London identifies Bromley, Havering, and Sutton as the most affordable boroughs for a typical one-bed, at around 34% of local median pay.
That matters because the cheapest borough is not always the one that feels easiest to afford once the rest of your budget comes into play.
The Most Expensive London Boroughs To Rent Right Now
The top end of London’s rental market sits in a different price bracket altogether, and it changes what counts as a workable budget.
Why Central And Inner-west Boroughs Cost More
The highest rents cluster in central and inner-west London. Kensington and Chelsea, Westminster, Islington, Hammersmith and Fulham, and Camden sit at the premium end of the table.
These are not just slightly more expensive versions of average London. They are distinct high-cost markets, and many also overlap with the areas most commonly associated with wealth concentration in the capital. For more on that wider picture, see our guide to richest boroughs in london.
Which Expensive Boroughs Command The Biggest Premium
The top five are:
- Kensington & Chelsea
- Westminster
- Islington
- Hammersmith & Fulham
- Camden
These boroughs do not just sit above the London average. They sit well above most of the market. Just behind them are places such as Wandsworth and Hackney, which also sit firmly in the high-rent tier.
When Paying More May Still Make Sense
A higher-rent borough can still be rational if your non-negotiables are fixed. If cutting commute time, being near a specific campus or job cluster, or renting as a couple changes the rest of your budget, the “wrong” borough on paper can still be the right borough for your life.
The key is to pay more intentionally, not accidentally. The fastest way to do that is to compare the right home type, not just the borough-wide average.
What A 1-Bed, 2-Bed, Studio, Or Room Costs Across London
Borough averages are useful, but renters do not shop for average homes. They shop for rooms, studios, one-beds, and family homes.
Why Borough Averages Alone Can Mislead Solo Renters
The London Rents Map explicitly lets you compare rooms, studios, one-beds, two-beds, and larger homes using ONS PIPR data. That matters because a borough’s overall average can hide what a solo renter is actually likely to pay.
1-bedroom Flat Rent In London By Borough
Current ONS borough pages show a sharp one-bed spread. In Bexley, a one-bed averages £1,227; in Sutton, £1,228; in Camden, £1,907; in Hackney, £1,947; in Westminster, £2,493; and in Kensington & Chelsea, £2,588.
For a solo renter, those one-bed numbers are usually more decision-ready than the borough-wide averages. They tell you much faster whether a borough is in play, marginal, or out of reach.
2-bedroom Flat Rent In London By Borough
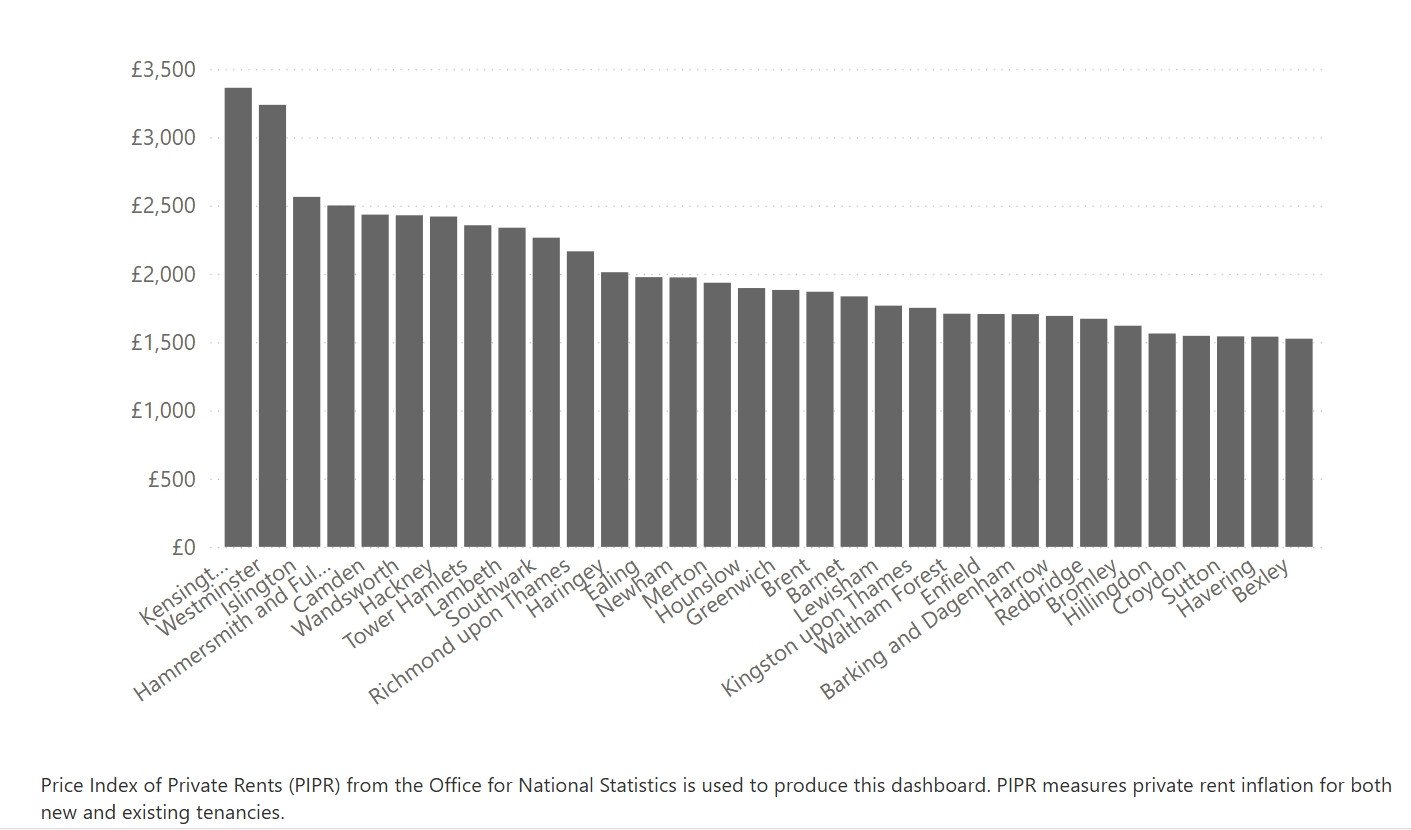
The two-bed step-up is meaningful. In the same current ONS pages, Bexleyis £1,525, Suttonis £1,542, Hackneyis £2,420, Camdenis £2,434, Westminsteris £3,238, and Kensington & Chelseais £3,363.
That is why couples and small families should not base a search on one-bed expectations. Moving from one bed to two can change the viable borough list materially, especially in inner London.
Studios, Rooms, And Flatshares
For students and many single renters, the smartest move is to ignore borough-wide averages at first and use room, studio, and one-bed filterson the official London Rents Map. City Hall built the tool for exactly that kind of comparison, and it reflects both new and existing tenanciesrather than just one slice of the market.
The most common mistake here is using the borough-wide figure as a personal rent target. For students and flatsharers, room and studio comparisons are usually the more realistic place to start.
Best next step for students: choose your travel corridor first, then compare rooms and studios in the boroughs that actually work for your daily route.
Rent Affordability By Borough, Not Just Rent By Borough
A borough can be cheap without being especially comfortable financially, and expensive without being automatically impossible. Headline rent tells you what a borough costs. Affordability tells you how hard that rent is likely to bite.
Which Boroughs Are Cheapest By Headline Rent
On headline rent alone, Bexley, Sutton, Hillingdon, Croydon, and Haveringare the lowest-cost group.
Trust for London says a typical one-bed costs 52% of median pre-tax pay across London, compared with 42% in the rest of England. When rent is compared with earnings, Bromley, Havering, and Sutton come out best, while Westminster and Kensington and Chelsea perform worst at nearly 70% of local median pay.
If you want the wider income context behind those affordability gaps, see our guide to poorest boroughs in london.
Which Boroughs Are Most Affordable Relative To Earnings
Affordability changes the ranking. When rent is compared with earnings, boroughs such as Bromley, Havering, and Suttontend to perform better, while Westminsterand Kensington & Chelseaperform worst.
That shift matters because renters do not live inside rent tables. They live inside income constraints.
Which Boroughs Look Expensive But May Still Work For Certain Renters
Some higher-rent boroughs can still make sense if they reduce other major costs, especially travel time and commuting spend.
That does not make them cheap. It simply means value depends on how the borough fits the rest of your life.
Why “best Value” Is Different From “lowest Rent”
Lowest rent is a price answer. Best value is a lifestyle answer. A borough can look cheap on paper and still feel poor value once commuting, home size, and earnings are factored in.
Expert Take
I would trust “best value” only after I had checked four things together:
- borough average
- property type
- affordability against earnings
- real monthly costs
That framework matters even more when people ask whether £2,000 or £3,000 is enough.
Is £2,000 Or £3,000 A Month Enough To Live In London?
This question only works if you separate rent budget from total monthly budget.
Budget Scenario For A Student
For students, £2,000can be workable in parts of London, but it should be tested against room, studio, and shared housingrather than borough-wide averages.
Student renters usually need a different comparison lens from general borough averages.
Budget Scenario For A Single Renter
For a solo renter using £2,000 as a rent budget, the market is mixed but workable. It fits many outer boroughs and some mid-range options, but not much of premium inner London.
At £3,000, the range becomes much wider, though the top end of the market still pushes beyond it.
Budget Scenario For A Couple
For couples, the two-bed market matters more than the one-bed market. A borough that feels manageable for solo renting can look very different once a second bedroom is required.
That is why couples should test boroughs against two-bed examples early, not as an afterthought.
What These Budgets Realistically Buy In Different Boroughs
A simple way to frame it:
- Around £2,000 rent: viable in many outer boroughs, selective in mid-market boroughs, tight in much of inner London.
- Around £3,000 rent: strong across most boroughs, but still not unlimited.
- Below the London averagedoes not mean impossible; it means your borough and property-type filters need to be sharper.
The Real Monthly Cost Beyond The Headline Rent
Rent is the biggest line in most budgets, but it is not the whole monthly cost of living in a borough.
Council Tax, Transport, Utilities, And Internet
Your actual monthly outgoings usually include:
- council tax,
- gas and electricity,
- water,
- broadband,
- mobile costs,
- commuting or travel passes,
- moving costs and deposits at the front end.
A borough that looks affordable on rent can still feel tight once those costs land. That is why I would never tell someone to choose a borough from the rent figure alone.
Commute Cost Vs Rent Savings
A cheaper borough does not always create a cheaper life. If rent falls but your time and travel burden rise sharply, the savings may be smaller than they look on paper.
The cleanest decision process is to test rent and commute together. A modestly higher-rent borough can be rational if it materially reduces the cost or stress of getting where you need to be several times a week.
Why A Cheaper Borough Is Not Always The Cheapest Lifestyle Choice
Here is the short checklist I would use before ruling a borough in or out:
Quick shortlist checklist
- Check the borough-wide average rent.
- Check the right property type for your search.
- Estimate your commuting pattern, not just your postcode preference.
- Add the non-rent costs you cannot avoid.
- Only then compare boroughs side by side.
That shortlist method makes the next section much easier, because now you can match borough type to your real priorities.
How To Choose The Best London Borough For Your Budget And Lifestyle
The goal is not to find one perfect borough. It is to find the right type of borough for how you live and what you can afford.
Best Borough Types For Low Budgets
If your priority is the lowest headline rent, start with Bexley, Sutton, Hillingdon, Croydon, and Havering. They are the current lowest-cost cluster on the ONS monthly figures.
Best Borough Types For Commuting Into Central London
If your priority is commuting, I would not choose from the borough table alone. I would first map your route, then compare only the boroughs that keep the journey tolerable. That keeps you from “saving” on rent in a way that makes the rest of the week worse.
Best Borough Types For Students
Students should usually start with room, studio, and one-bed views, not borough-wide averages. City Hall’s London Rents Map is built for that comparison and is more useful than a generic borough list if your real search is “What can I rent near my university or transport corridor?”
Start with the journey you need to make most often, then compare rooms and studios in the boroughs on that route.
Best Borough Types For Solo Renters
Solo renters should compare one-bedfigures first. On current ONS pages, the gap between one-bed examples in Bexley/Suttonand Westminster/Kensington & Chelseais dramatic enough to change the shortlist immediately.
Solo renters should check one-bed prices first. If the one-bed figure is already above your ceiling, the borough only stays realistic if you are willing to share or change home type.
Best Borough Types For Couples And Small Families
Couples and small families should move quickly to two-bed and three-bedcomparisons, because that is where the real budget pressure shows up. A borough that looks possible on a one-bed can become borderline once you shift up to a two-bed.
Decision table
| If your priority is | Start by shortlisting |
| Lowest headline rent | Bexley, Sutton, Hillingdon, Croydon, Havering |
| Best affordability vs local pay | Bromley, Havering, Sutton |
| Solo renting | Boroughs where current one-bed figures stay under your cap |
| Couple or small family | Boroughs where current two-bed figures still fit after bills |
| Strong commute requirement | Boroughs that work on your actual travel corridor, then compare rents |
How To Read London Rent Data Without Getting Misled
Most confusion comes from comparing figures that were never measuring the same thing.
Average Rent Vs Median Rent
Mean and median are not interchangeable. The mean can be pulled upward by more expensive housing stock, while the median shows the midpoint.
City Hall’s borough comparison outputs include mean, median, and quartile views, which is one reason the official map is more useful than a simple ranked list.
Achieved Rents Vs Asking Rents
Official rent series are not the same as portal asking rents. London City Hall says the London Rents Map now uses ONS PIPR data, which tracks achieved rents for new and existing tenancies. That is a more robust comparison base than advertised-price snapshots alone.
Rolling Annual Borough Data Vs Latest Monthly Citywide Snapshots
Some official tools show a rolling borough comparison, while others show the freshest monthly snapshot. Both are useful, but they answer slightly different questions.
Why Different Websites Show Different Figures
The usual reasons are:
- different dates,
- different property types,
- different methodologies.
FAQs About Average Rent In London By Borough
What Is The Average Rent In London Boroughs?
London borough rents vary widely, so the useful answer is a borough-by-borough table rather than one city number. The official London average was £2,273in February 2026, but boroughs ranged from £1,536 in Bexleyto £3,628 in Kensington & Chelsea.
What Is The Cheapest Borough To Rent In London?
On the latest ONS monthly borough figures, Bexleyis the cheapest London borough, with an average monthly private rent of £1,536.
What Is The Most Expensive Borough To Rent In London?
On the latest ONS monthly borough figures, Kensington & Chelseais the most expensive borough, at £3,628 per monthon average.
Which Borough Has The Highest Rent?
The current ONS local-area data shows Kensington & Chelseahas the highest average monthly private rent among London boroughs.
Is £2,000 A Month Enough To Live In London?
It can be workable as a rent budgetin cheaper outer boroughs and for some one-bed or shared options, but it sits below the current London-wide average rent of £2,273.
Is £3,000 A Month Enough To Live In London?
As a rent budget, £3,000 clears the current London average and most borough-wide averages, but it still does not fully cover the top end of the market in Westminsteror Kensington & Chelsea.
What Is The Average Rent In London For Students?
There is no single student-rent figure that maps neatly onto borough averages. Students should compare rooms, studios, and one-bedsusing the official London Rents Map rather than relying on all-property borough averages alone.
What Is The Average Rent In London For A Single Person?
For a single person, one-bedand roomfigures are more useful than borough-wide averages. Current one-bed examples range from about £1,227 in Bexleyto £2,588 in Kensington & Chelsea.
Quick Recap
The borough average is only the starting point. The real decision comes from matching it with home type, affordability, and total monthly cost.
Start with the 32-borough table, narrow by the right home size, then pressure-test the shortlist against affordability and real monthly costs. That is what turns rent data into a decision.
Jump to
Average Rent In London By Borough - 32 Boroughs, 1-Bed Costs, And Affordability
Average Rent In London By Borough At A Glance
Average Rent In All 32 London Boroughs
Cheapest London Boroughs To Rent Right Now
The Most Expensive London Boroughs To Rent Right Now
What A 1-Bed, 2-Bed, Studio, Or Room Costs Across London
Rent Affordability By Borough, Not Just Rent By Borough
Is £2,000 Or £3,000 A Month Enough To Live In London?
The Real Monthly Cost Beyond The Headline Rent
How To Choose The Best London Borough For Your Budget And Lifestyle
How To Read London Rent Data Without Getting Misled
FAQs About Average Rent In London By Borough
Quick Recap

James Rowley
Author
James Rowley is a London-based writer and researcher covering London life, cultural geography, London travel, live London webcam pages and selected public figures across entertainment, sport, business and public life.
For over 15 years, he has focused on verified sources, first-hand local context and clear explanations that help readers understand both places and people more deeply. His work combines street-level London knowledge with careful research into career credits, media work, business interests and, where relevant, transparently explained net worth estimates.
He writes and reviews articles published on LondonWebcam.
Latest Articles
Popular Articles